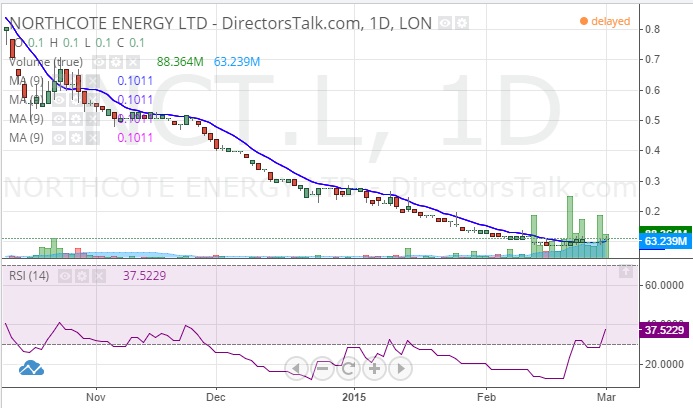
What has been noticeable over much of the past week is the way that there has been quite a steep rise in trading volume as far as Northcote Energy (LON:NCT). As seasoned technical traders will be aware, this can be both a logical forerunner of recovery, or in some rather unhelpful cases, merely signify we may be due a resumption of the ongoing trend. However, the “trick” in such circumstances is to await for conformational signals, and in this week’s recovery of the 20 day moving average at 0.10p we would appear to have the first. But given the extended and persistent breakdown from a September bull trap top through 1p, and subsequent November dead cross sell signal between the 50 day and 200 day moving averages, it may be worth waiting for a more overt signal than merely the recovery of the 20 day line.
The best on offer in the near term may actually be a close back the top of the February gap to the downside at 0.11p, which may be an exhaustion feature. If this is the case then a sustained break back above this level – for instance, on a weekly close basis, could be a worth following. Indeed, the implied target above 0.11p could be as great as former initial January 2015 resistance towards 0.27p. The timeframe on such a move is seen as being 1-2 months after the gap is cleared.