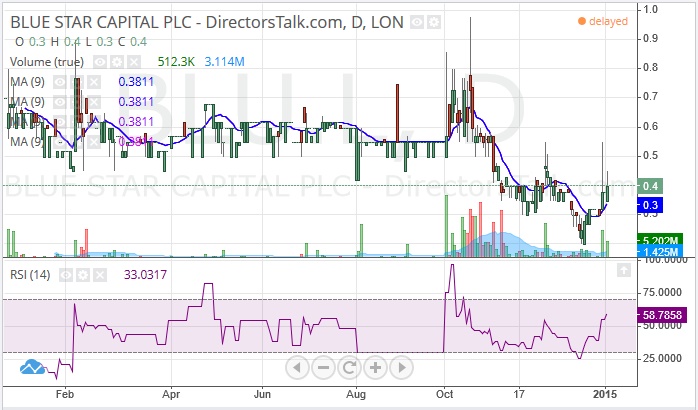
Although it is clear from the recent history of the daily chart shares of Blue Star Capital (LSE: BLU) are not the most liquid in town, there is plenty in terms of the price action which allows us to make a near term call on where this particular market may be headed. This is said in the wake of December’s sharp and brief bear trap rebound from below the former 0.3p November support. The subsequent recovery back above 0.3p took the former of a brief bull flag consolidation resting on the 10 day moving average currently at 0.3p, followed by a quite sharp spike to end last week. The expectation following these developments is that we can assume a reversion back towards the 0.3p – 1p trading range which has been in force since the end of 2013. Those who are cautious on the prospects of an immediate sustained bounce for Blue Star Capital can choose to wait on a couple of possible momentum triggers. They would be either an end of day close back above the 50 day moving average now at 0.41p or the 0.54p level, which is where the 200 day moving average is currently running. That said, the latest push for the RSI indicator to 56, versus neutral 50, does tip the technical bias to the upside for aggressive traders.