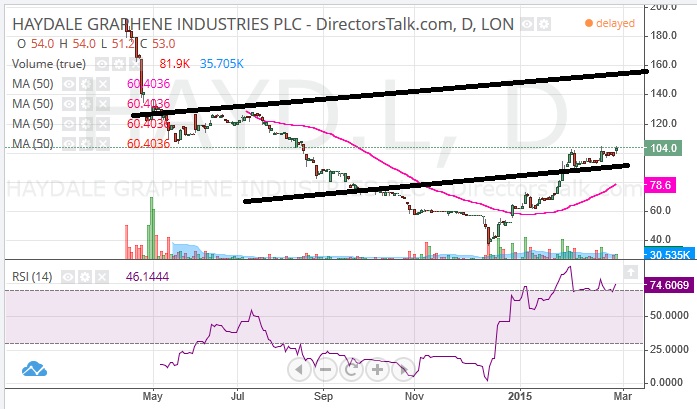
Although it is normally not wise to overemphasise the bullishness of a stock or market, given the way that by definition there is always room for disappointment, in the case of Haydale Graphene Industries it is difficult not to be swept along with the chart pattern which has been unfolding on the daily time-frame since the autumn.

This is because it consists of a classic V shaped reversal, one that is currently delivering an extended bull flag break out through the 100p zone. What is also key here is the way that there has been a January break of the still falling 200 day moving average at 89p, the type of phenomenon which is only seen in the more bullish of situations.
Therefore the view now is that provided there is no break back below the 200 day line one would be looking for a fresh break to the upside. The favoured destination currently is the top of a rising trend channel from May last year with its floor running level with the 200 day line.
The 2014 resistance line projection is heading as high as £1.60, and this is the destination we expect for the next 1 to 2 months. Ideally, there would now be no sustained price action back below the 20 day moving average at 97p ahead of the big push to the upside. Near-term traders may use this as an alternative stop loss level.


