Even casual observation of the daily chart of Noricum Gold in the past year will reveal that it has not been a happy time for the stock. This is because there has been a volatile descent from the early summer 2014 when the shares were trading towards 0.8p, to the bottoming out process which started in November below 0.2p.
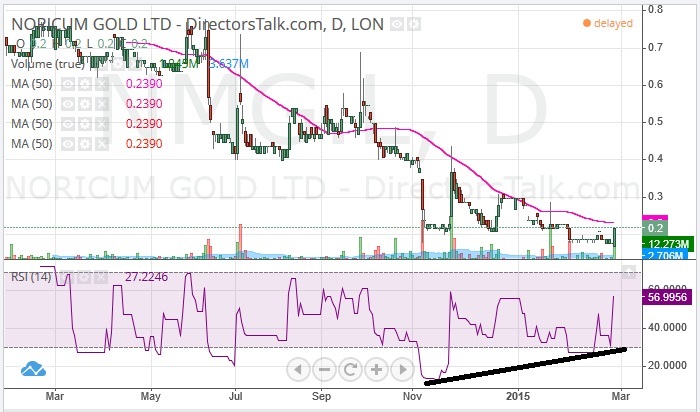
While it can be argued that this corrective phase is still underway, there appears to be enough in terms of evidence in the RSI window that a turnaround may be imminent. This is because there has been an uptrend line for the oscillator since November with the support line running through 25 at the moment.
So far in February have seen a double bounce off the November feature and a breakthrough RSI 50, the type of events which normally signify the beginning of a turnaround.
All that is required now would be decent weekly close above 50 day moving average at 0.23p to suggest that an extended bear trap rebound from below 0.2p is finally underway.
The expectation after this would be that we see progress towards the 200 day moving average at 0.4p over the following 4-6 weeks. But only a strong clearance of the 200 day line would be regarded to flag the likelihood that shares of Noricum Gold were ready to revisit the best levels of last year.