For Rame Energy (LON:RAME) it has been the case that the bulls have been on the back foot for much of the post autumn period. That said the worst of the declines were over by the middle part of January and since then there has been a tentative attempt at recovery. Indeed, we have seen multiple probes towards the floor and falling trend channel from May, with the big plus point being that so far there has been no need to probe as low as the 8p level. The explanation of this may be the way that since the middle of January we have seen the RSI oscillator put in higher lows, a phenomenon which could be the start of a turnaround, given that this indicator is frequently a leading influence on the share price.
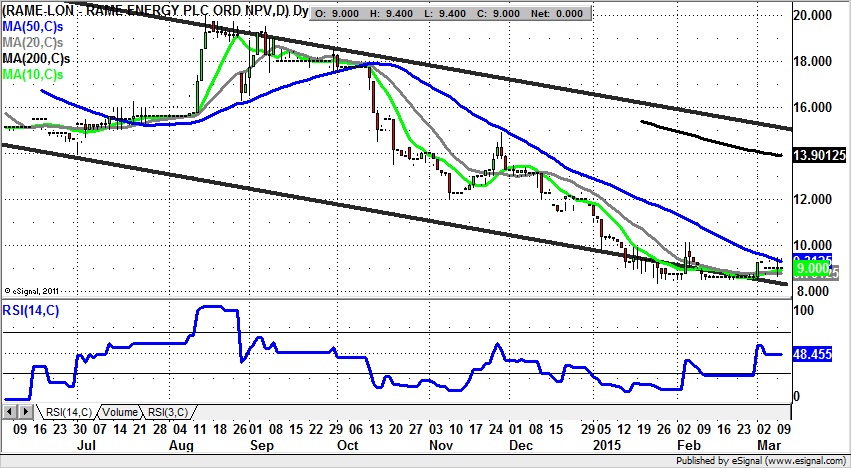
However, given the extended declines in recent months it may be that most traders rather than bargain hunting at current levels, feel the need to wait on a momentum trigger. Such a buy trigger would take the form of a weekly close above the 50 day moving average currently 9.4p, and ideally combined with the clearance of the RSI 50 level, versus 48 currently.
As far as what the upside could be over the next 1 to 2 months-following any 50 day line break, one would be looking to a return of late November resistance/the 200 day moving average area currently at 13.9p. Indeed, the expectation is of an intermediate rally to emerge over the next few weeks, especially if there is no new low towards 8p delivered over the next few sessions.