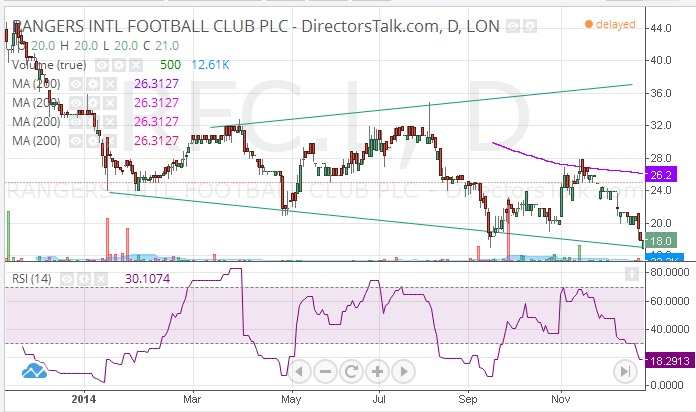
While it is to be presumed that trading shares of football clubs is no less fraught than owning them, there are some useful technical tips that we can get from the daily chart of Rangers International Football Club (LSE:RFC) at the moment.
The main one is the way that since the end of 2013 we have seen a an extended basing for the shares, although September and December last year did see temporary overshoot to the downside. What is also noticeable about the December low is that it was marginally higher than the floor made in September, something which is a significant technical event.
What can be said now is that even if the overall downtrend continues roughly at or just below the 200 day moving average of 25p, at least while there is no weekly close below the 20p flooring of the trend channel from the end of last year we can expect further positive consolidation. The favoured scenario would be sustained price action over the 200 day moving average by the end of this week / next week, leading to the 2014 resistance line projection at 37p over the following 1 to 2 months.