The stock market cliche is that no one rings a bell at or the bottom of the market. While the implication of this cliche is clearly correct, especially given the way that volatility tends to increase at the endpoints of the price action, from a technical perspective there are very often characteristics that feature time again at either end of the range.
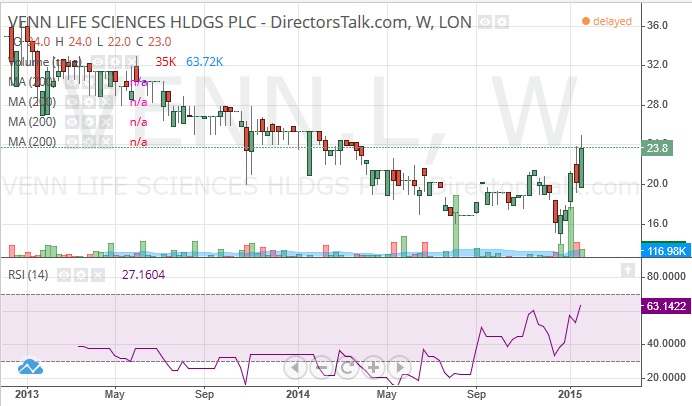
This concept is illustrated very well on the daily chart of Venn Life Sciences (LSE:VENN) in recent months as we have a turnaround developed and then sustained itself. In fact, it is evident over the past couple of years the shares have had a generally slow drift from the beginning of 2013 process which appeared to reach a climax last month with a gap to the downside below 15p and below what was former 2014 support just above this level.
Indeed, what we were treated to in December was a classic island day reversal, one of the more powerful bullish charting configurations in the book. Since then we have enjoyed not only a bear trap recovery back above the initial 2014 support at 16p from August, but also a break above and then test for support at the still falling 200 day moving average now at 19p. The now view is that we are in a V shaped Bull flag above the 200 day line and that provided there is no break back below former late November resistance and 21.5p the stock should accelerate towards two-year resistance at 35p plus over the next 1 to 2 months.