Major Asset Class Returns for 1st Quarter 2023, GBP sterling terms.

(Source: Bloomberg, TEAM)
Global Equity Sector Returns for 1st Quarter 2023, GBP sterling terms.
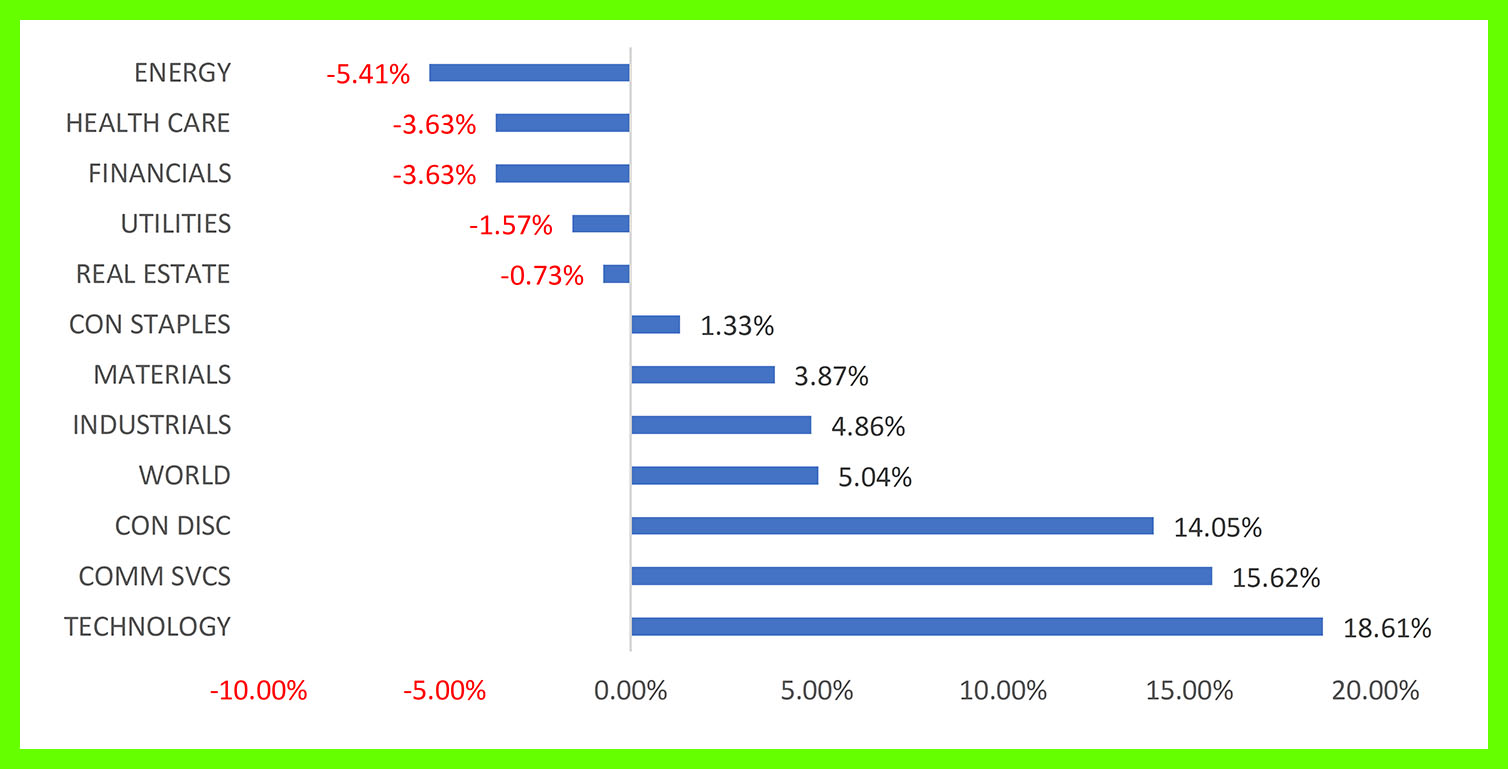
(Source: Bloomberg, TEAM)
Investment Review & Outlook 1st Quarter 2023
Heartburn
Headline returns over the reporting period disguise to some degree what has been another extraordinary quarter for financial markets. Amidst the ongoing tug-of-war between bulls and bears, the one constant has been heightened volatility across asset classes.
In addition to the ongoing hot war in Eastern Europe, we can now add a historical inversion of the US yield curve, civil unrest on the streets of Paris and Tel Aviv, a simmering banking crisis in the US regional banking sector, and the enforced takeover of Credit Suisse by UBS.
Against the backdrop of one of the most aggressive global monetary tightening cycles in history, gyrating asset prices during the quarter did not come as a shock. However, what is sure to have surprised many is the resilience exhibited by credit and equity markets.
Out of the Blocks
An annus horribilis for global risk assets in 2022 prompted many commentators to project another difficult year for investors. Yet, as is so often the case, Mr. Market spectacularly wrong-footed the crowd.
Like the proverbial spring at full tension, market developments need only move from awful to slightly-less-awful to create a shift in sentiment, catapulting the spring in the opposite direction. Several catalysts emerged during January to boost asset prices across the board.
On the valuation front, the large-cap S&P 500 Index in the US and the tech-heavy Nasdaq entered this year some 30-40% cheaper than this time last year. Selective high-growth stocks had given up all their post COVID gains and more, prompting interest for those with a medium to long term time horizon.
Turning to the economic picture, arguably the three most important developments have been:
- Europe emerging from the harshest winter months having side-stepped the blackouts and energy supply struggles that many were forecasting back in the fourth quarter of 2022,
- A remarkably resilient American economy, led by the consumer, and
- 3) China’s critically important, but low-key, U-turn on its zero-tolerance COVID approach, in addition to an extensive policy support package for the beleaguered property sector.
Each has driven positive economic data surprises, triggering a rapid change in the consensus growth outlook for regions and the global economy from a ‘hard landing’ through ‘soft landing’ to a potential ‘no landing’ scenario, an outcome that few, if any, forecasters were projecting just a few months ago.
Rattled
After a blistering month for risk assets, financial markets performed an abrupt about-turn during February as hot economic data and stickier inflation prints, led by the United States, materially shifted the global outlook for interest rates to a higher for considerably longer scenario.
Broad personal consumption, wages, light vehicle sales and home sales all jumped in January to multi-month highs, with the latter particularly noteworthy given that long-term mortgage rates remain several hundred basis points higher than this time last year.
A resilient American consumer was evidenced by soft (survey) data including positive surprises from the ISM Purchasing Manufacturers Index, the University of Michigan Consumer Sentiment Index, and the National Federation of Independent Small Business Optimism Index.
Arguably what will have alarmed policymakers most is the employment data. Nonfarm payrolls surged by 517,000 for the month, with the unemployment rate dropping to 3.4%, the lowest level since 1969 (one must look back to 1953 to find a lower figure).
Consequently, the likelihood of a central bank pause, or pivot, reversed to a close-to-zero possibility. Instead, markets were rattled by the renewed prospect of a more sustained, and potentially more aggressive, path of monetary policy over the coming quarters.
Trilemma
March delivered more drama than an episode of Jerry Springer. As per lessons from history, the speed and magnitude of interest rate hikes from global central banks finally began to bite, exposing fragilities in the system.
An obscure northern California bank catering to venture capital and technology businesses by the name of Silicon Valley Bank, or SVB, had enjoyed super-charged growth to become the 16th largest American bank by assets. During March it would spectacularly fail, succumbing to an old-fashioned bank run.
The source of the collapse was not obscure sub-prime mortgages to struggling homebuyers (as per the 2008 Global Financial Crisis) but what are considered the safest securities in the marketplace: US Treasuries. Unfortunately for SVB, that term applies to credit quality, not asset price stability.
Flush with cash deposits from thriving Silicon Valley businesses and eager to earn a return on that money, SVB purchased billions of dollars’ worth of long-dated US Treasury bonds. The problem was that the bulk of the purchases were made during a period of ultra-low interest rates.
As interest rates accelerated at the fastest pace in decades, ultra-sensitive long-dated Treasury bonds (prices move inversely to rates) spiralled downward in value. Theoretically, this is only an issue if one needs to sell a bond before it matures. Unfortunately for SVB, that is precisely what occurred.
SVB’s clients, the bulk of whom had deposited more than $250,000 (the cap on federal deposit insurance) began pulling their deposits en masse, forcing the bank to sell its Treasury bond and mortgage-backed securities at steep losses to fund deposit redemptions. Caught in a doom loop, SVB collapsed within days.
Fears of contagion rapidly spread, forcing the Department of the Treasury, the Fed, and the Federal Deposit Insurance Corp to guarantee emergency protection for all depositors at SVB and New York’s Signature Bank, which collapsed around the same time. In addition, the Fed loaned billions to banks post the event to ensure their liquidity, including new emergency programmes that offered generous terms for borrowing against Treasuries and other bonds that had lost value.
For now, markets appear to have taken the view that a systemic event has been averted. Regardless, the episode has made a precarious balancing act for central banks, and the Fed in particular, more difficult. Labelled the trilemma1, it highlights the ongoing challenge of simultaneously reducing inflation, minimizing the hit to growth and jobs, and maintaining the stability of the financial system.
Outlook
That the Fed took the decision to enact a further 25 basis point rare hike after the banking turmoil triggered by SVB is instructive to how far inflation remains from what would be considered a ‘comfortable level’ of approximately 2%.
Shown below, US Core PCE inflation (a measure that excludes food and energy components that are subject to dramatic swings in prices), registered +4.6% YoY in February, whilst the Fed’s preferred ‘super core rate’ (PCE services less energy and housing) remains stubbornly high at +4%.

To intensify Chairman Powell’s heartburn, falling borrowing costs combined with sharply rising interest income on the back of a massive ‘excess savings’ pool, threaten a mini reacceleration of the economy that is set to feed through to the inflation data over the coming months.
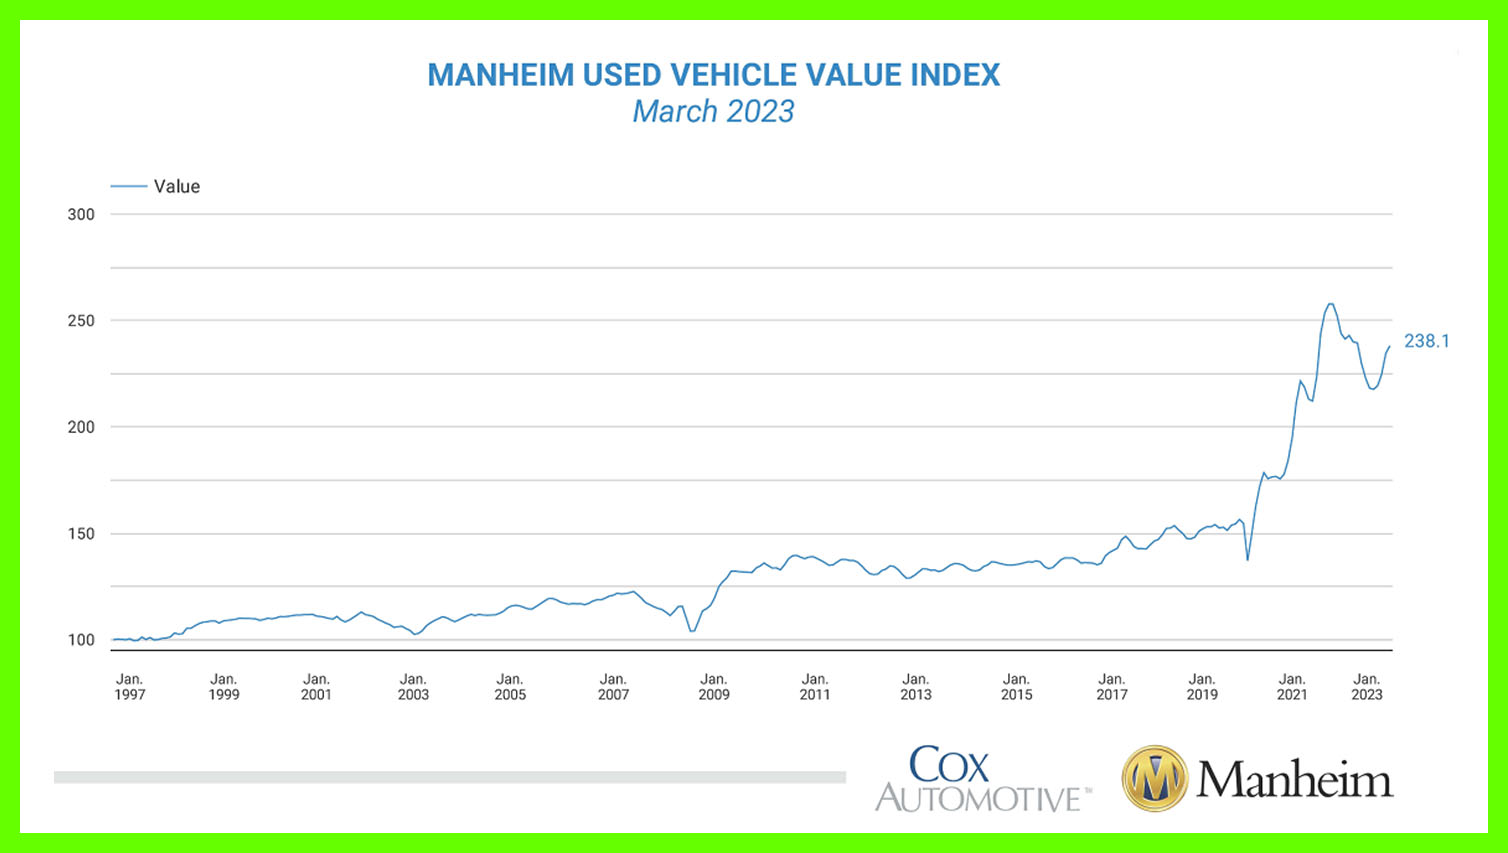
Two examples include the Manheim User Car Index, a leading indicator of Used Car CPI, that has exploded higher in the past couple of months (shown below), and multi-family housing starts that increased by 130k units in February. Both datasets point to an elongation of the current economic cycle.
What gives? We suspect part of the answer lies with US federal tax receipts, which have increased by approximately $1 trillion (or +4% of US GDP) since 2020 (www.fiscaldata.treasury.gov):
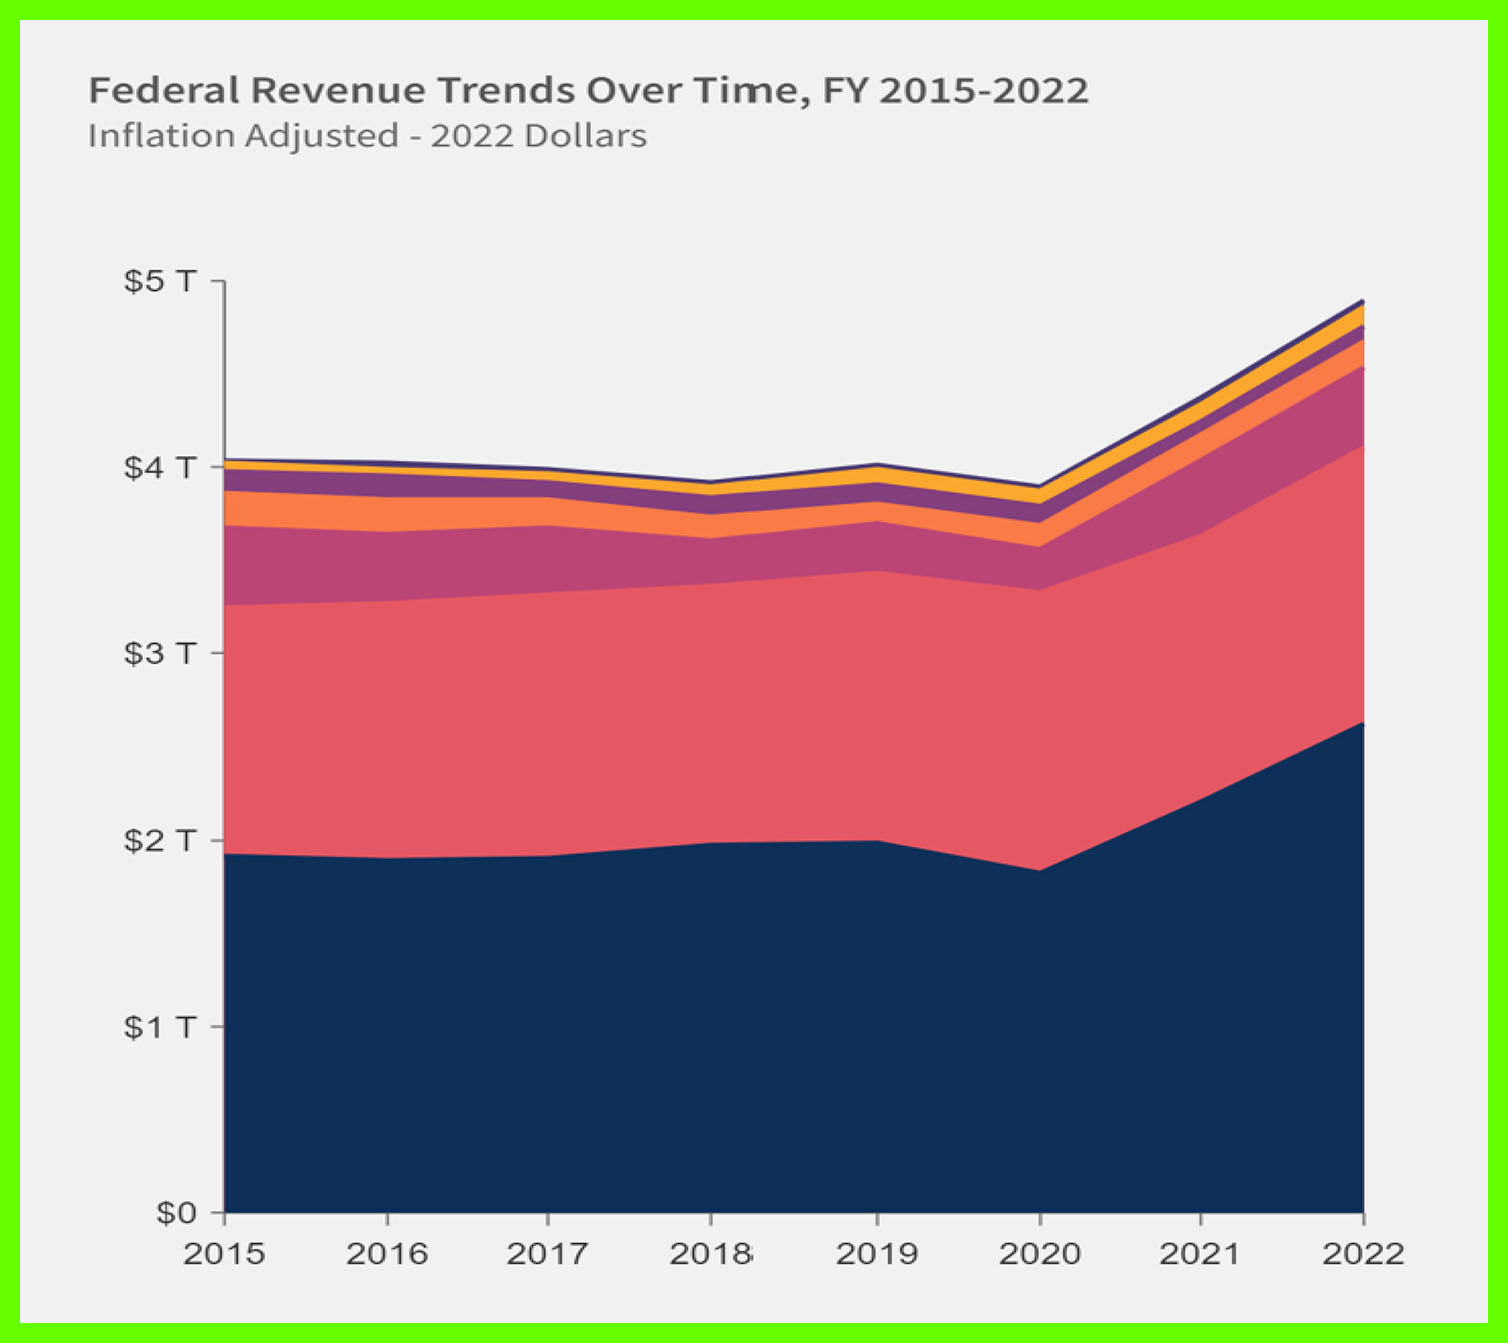
This would indicate that American individual and household balance sheets remain in (broadly) decent shape following the government’s extraordinary response to COVID-19, including direct transfer payments in the form of cash, or ‘helicopter money’.
Whilst various estimates of excess household savings (defined as the gap between actual monthly personal savings and the pre-pandemic level of savings in February 2020) suggest the aggregate level has fallen rapidly, the strength of recent consumer data indicates otherwise. This has been corroborated by upward revisions to US savings rate data announced in late February.
The average personal savings rate for the second half of 2022 was revised up from 2.8% to 3.6% of disposable income, with the December savings rate revised also revised up from 3.4% to 4.4%. It has since jumped to 4.6% in February 2023.
All told, cumulative excess savings have not yet been depleted, as many surmised, although they have declined by approximately 50% from their August 2021 peak of $2.15T to just over $1T. At the current run rate, this excess savings pool will be exhausted by the summer of 2024:

The above lent credence to the prevailing market narrative prior to the SVB news that forward earnings from corporate America would not be as adversely affected as earlier feared. Certainly, that is the outcome suggested by the outsized performance of technology and e-commerce stocks during the first quarter.
Arguably that message has been reinforced by credit markets, where spreads (essentially the difference between a risk-free US treasury bond and an alternative corporate bond issuer) have been remarkably well-behaved overall.
Mixed signals
However, an altogether different signal has emerged from other asset markets including gold and bonds, where the SVB debacle provoked price reactions that a) indicate the Fed is closer to the end than the beginning of its tightening cycle (or should be) and b) that a recession in 2023 is all but guaranteed.
Chief among the harbingers of doom is the relationship between the Fed Funds Rate (FFR) and the 2-Year Treasury yield curve (2Y) which inverted by a staggering 100+ basis points, the deepest inversion ever during a Fed hiking cycle.
To recap, an inverted yield curve occurs when short-term debt instruments have higher yields than long-term instruments of the same credit risk profile. It is an unusual occurrence and reflects bond investors’ expectations for a decline in longer-term interest rates, typically due to a recession.
As the following chart from our friends at 3Fourteen illustrates, FFR-2Y inversions are typically associated with systemic events and/or recessions and can provide important signals regarding future Fed policy. The list of dates where an inversion of this magnitude has occurred historically does not make for great reading:

Appreciating the nuances of individual case studies, in the 12 months following yield curve inversions of this depth, the S&P 500 large cap equity index suffers, on average, a -25% max drawdown. That compares to a max drawdown of slightly less than -12% in a typical year for markets historically2. Perhaps most importantly, these inversions typically occur before major market tumbles.
Underlying tension in markets YTD has been the result of two opposing forces: inflation data and earnings/economic forces. This has yet to be fully resolved, creating rangebound market conditions. Difficulty in reading the tea leaves is reflected by the stasis that has gripped forecasters on Wall Street who have failed to reassess their predictions for where markets may finish this year.
Whether the US economy enters recession territory in 2023 is likely to determine the future path of asset prices, and whether markets revisit and test the October 2022 lows, or break out to fresh upside highs.
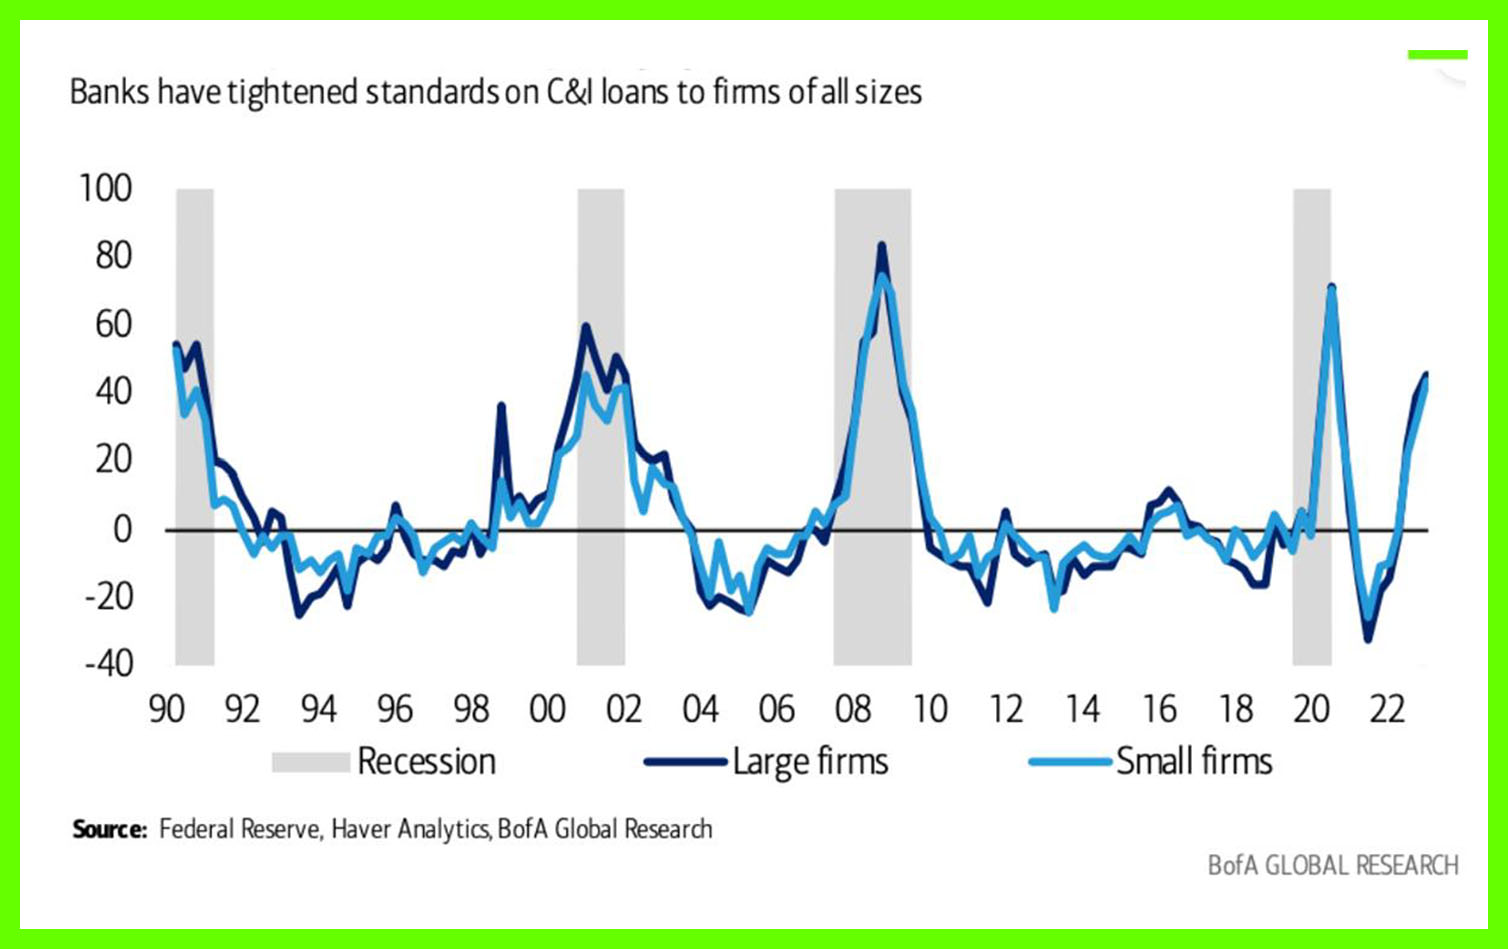
Amongst many, two related signals we are watching closely are: 1) Developments in the Commercial and Industrial (C&I) loans market, a c. $3T business for banks nationwide. C&I loans involve lump sum or revolving credit facilities to small businesses (less than 500 employees), for capital investment, expansion, hiring efforts and/or to provide working capital.
Between 2000 and 2019, these businesses have been responsible for approximately 65% of new employment in the US. When banks begin refusing loans or diverting capital away from C&I loans, stresses begin to appear in the economy. Small business owner confidence subsides, new hiring ceases, leading to meaningful drops in activity data.
Shown below is the net percentage of banks scaling back their C&I loans through a tightening in lending standards, courtesy of Bank of America Merrill Lynch. Worryingly, the lags between any tightening in lending standards and real economic outcomes (impact to personal consumption, employment, growth) is short, appearing after just 2-3 quarters:
2) The trajectory of corporate earnings. A critical earnings results season is upon us, with corporate America scheduled to begin reporting in mid-April. Looking back at history, aggregate earnings for the S&P500 large cap index stabilises, and then accelerates, 3-6 months after a major bear market low.
If October 2022 was ‘the low’ for this market cycle, we can expect earnings to confirm in the coming 4-6 weeks. Events during March are likely, on balance, to weigh on forward looking estimates and indeed financial sector estimates are, unsurprisingly, being marked down sharply.
As per the chart below (credit: Trahan Macro Research), earnings are now contracting across small cap stocks, midcaps, and the S&P 500 on an aggregate basis. For the S&P, consensus estimates are for a -8% contraction in the growth rate in Q1, followed by a -6% contraction in Q2. The full year calendar year 2023 estimate is at -2% and coming down. Our sense is that there is downside risk to this number.

What might constitute a muddle-through-scenario? Should the earnings contraction turn out to be modest, this may be well received by the market, assuming the Fed pivots by creating a more favourable liquidity backdrop. A Fed pause, or pivot, whenever it comes, will be determined by inflation.
Asset Allocation & Positioning Summary
TEAM enters the 2nd quarter of 2023 acknowledging that central bank activity, a critically important earnings season and geopolitical risks retain the capacity to destabilise markets, particularly in the first half of this year.
We continue to advocate a relatively conservative posture in terms of risk exposure, with a focus on playing ‘good defence’ rather than blindly chasing riskier pockets of the market.
Equities
With central bank activity likely to keep asset prices rangebound, our preference is to invest in quality companies with strong balance sheets and superior pricing power in their sector that generate consistent, dependable cash flow. Many of these companies are found in traditionally lower beta sectors, such as healthcare and consumer staples. Activity by the Fed that points to a pause or pivot in hikes may, in due course, provide a rotation opportunity into longer duration, higher growth stocks.
Emerging market (EM) equities have underperformed developed markets for two straight years on the back of the surging US dollar, China’s zero-COVID policy and risk aversion across asset classes. However, the recent depreciation, of the dollar, China’s move towards a full re-opening, and a widening growth and earnings expectations gap over developed markets should provide tailwinds for a better year for EM.
From a regional perspective, we also have healthy exposure to Japanese equities that offer a margin of safety from a valuation perspective, and a potential kicker from wholesale change to Japanese corporate capital management.
The most interesting development regarding Japan during the quarter was an official publication from the Tokyo Stock Exchange that threatens the delisting of companies that are not making appropriate progress in improving investment returns to shareholders. It has been combined with adjustments to individual investment limits and improved tax breaks to encourage the greater retail participation in the equity market.
Fixed Interest
We anticipate a rebound in bond markets as economic activity and inflation slow in 2023. Typically, slowing inflation and corporate earnings fuel strong bond returns, particularly at the shorter duration end of the spectrum. Government and investment grade corporate bond yields are the highest they have been in more than a decade and can regain their status as a haven asset in portfolios.
Our preference is to own selective, good quality investment grade corporate bonds which provide an attractive yield above government bonds. The average GBP investment grade corporate bond now yields 5.75% compared to just 2% at the start of last year.
Cash has returned as a viable strategic allocation, offering low-to-mid single digit, risk-free returns that have been unavailable to investors for years. We anticipate holding modest levels of cash throughout the year and get paid as we patiently sit and take advantage of attractive entry points in other assets.
Alternative assets
Our framework continues to lean into energy stocks. Alongside attractive diversification characteristics relative to other sectors, the trend for crude oil is beginning to improve sharply. Our take is that during 2022 refineries enjoyed record profit margins. Scheduled maintenance made no economic sense for companies and was therefore mothballed until Q1 2023.
At the beginning of this year, domestic US refinery utilisation rates fell to levels only previously observed during deep recessions (2008, COVID). Our take is that this was not due to shrinking margins or lacklustre demand, but the deferred scheduled maintenance. Consequently, crude oil inventories built sharply during January and February. Coincidentally, China was still re-emerging from a nationwide COVID lockdown.
Fast forward to today and refining maintenance is complete. Companies are upping run (utilization) rates and increasing margins. In response, oil inventories are beginning to fall. A final technical factor has been a huge build in speculative short positions. Should the outlook continue to improve, these will need to be unwound.
Gold and gold miners were mainstays of TEAM’s real asset sleeve in 2023 and remain essential portfolio insurance. The positive long-term case for gold remains that the Fed, and by extension G7 central banks, will not be able to effectively normalise monetary policy. That has been made more evident by co-ordinated government responses to the COVID pandemic, and recent developments in the US banking sector.
Top of the list of asset classes we will avoid is property. Higher borrowing costs and the squeeze on incomes will have a big impact on affordability and we expect to see a correction in house prices. Globally, almost $175 billion of real estate credit is already considered ‘distressed’, according to Bloomberg.
The outlook for commercial property looks even more challenging, with the sector facing a confluence of headwinds, including declining occupancy rates, falling appraisal values, and rising defaults. Coupled with higher funding costs, elevated funding needs, and tightening lending standards, this appears to be a perfect storm.
Final point
In closing, our data driven investment framework indicates that we should continue to tread carefully as we await further evidence that the worst is behind us. At this juncture, the risk to reward for risk assets is not overly compelling, a position reflected in our asset allocation across our core range of strategies.
Geopolitical risks still loom large, and the lagged effects of the monetary tightening cycle and the global housing bust will start to bite hard in the second half. We have a hard time believing the recent SVB episode to be a ‘storm in a teacup’. In addition, the US debt ceiling limit has been breached and will need to be negotiated in the coming months. This is an underappreciated risk.
TEAM’s flexible investment framework, underpinned by a diverse asset allocation universe and the ability to tactically allocate with conviction, will remain critical as risks – and opportunities – present themselves in the months ahead.
TEAM plc (LON:TEAM) is building a new wealth, asset management and complementary financial services group. With a focus on the UK, Crown Dependencies and International Finance Centres, the strategy is to build local businesses of scale around TEAM’s core skill of providing investment management services.